
Preparing your data
Data preparation is tedious and time-consuming. We get it. But unless the data is properly prepared, your report design process is likely to be frustrating and unsuccessful. Time spent preparing your data will be worth it.
What does properly prepared data look like?
Organized. Data values are organized in columns and rows in a single table. No merged cells, and no titles or notes that span multiple columns.
Complete. All the values you need are in the data.
Consistent. Data in a column should be of the same type. Number columns should contain only numbers. Date columns should contain only dates.
Clean. Number formatting, leading and trailing spaces, carriage returns, and other weird values (e.g., "#N/A" and "#ERROR") are removed.
Column headers. The first row of your data should be your column header row. Column names should have letters, spaces, or underscores, and nothing else. Each column header should be unique.

Let's take it step-by-step
Your goal here is a single sheet containing all data organized into columns and rows, with the first row containing the column headers and each column containing values of the correct data type.
1. Review and understand your data
Interrogate your data early on. Do you know what the column headings mean? Do the values in the columns make sense? Are there any columns you need that are missing? If the data is not quite right, fix it before going to the next step.
2. Make a working copy of your data
As you are preparing your data, you may need to refer or revert to the original state of data. Therefore, it is very important that you make a working copy of your data and only make changes to the working copy.
3. Un-merge cells
Values should not span multiple columns or rows. Un-merge any merged cells.
4. Remove extra rows and sheets
The first row in your data should contain your column headers. Remove any rows above your column header row (e.g., report titles). Remove any other rows that do not contain data organized into columns (e.g., footnotes). If there are any sheets other than the one with your data, remove those.
5. Remove columns you don't need (optional)
Columns you don't need can be distracting during data preparation and report design, so it's a good idea to just remove them. (If you're not sure whether you need a particular column, just leave it in.)
6. Remove rows you don't need
Sometimes your data will contain rows you don't need. For example, let's say your data contains values broken out by state as well as values for the US. Because you can aggregate the state-level values to get the US values, you may not need the US records. Removing unneeded rows will simplify your ingredient definitions later on.
7. Revise column names as needed
The first row of your data should contain your column names. Your column names should be readable, brief, and contain only letters, spaces, and underscores. For example, if the column name is Student.First.Last.Name, you could change it to Student Name; if the column name is Revenue (per Proposal), you could change it to Revenue per proposal. Your column names will be used as labels, so better column names mean less work for you when defining columns and measures. Each column name should be unique.
8. Restructure data as needed
Consider each of your column headers. Does the column header itself contain a value that you'll want to use in your analysis? If so, you'll need to restructure your data.
A common example is data with separate columns for each year, quarter, or other time period. In other words, your data may look like this:
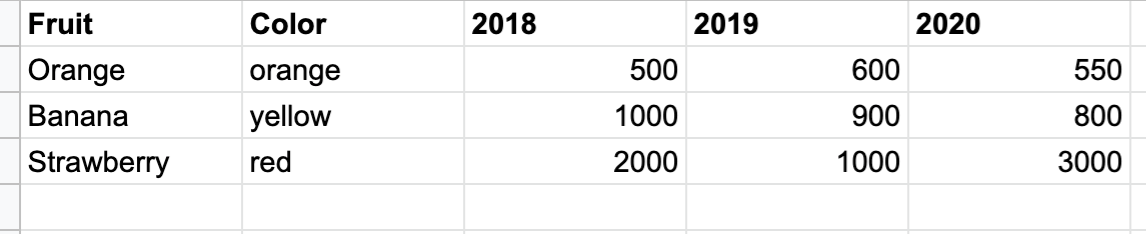
When it needs to look like this:
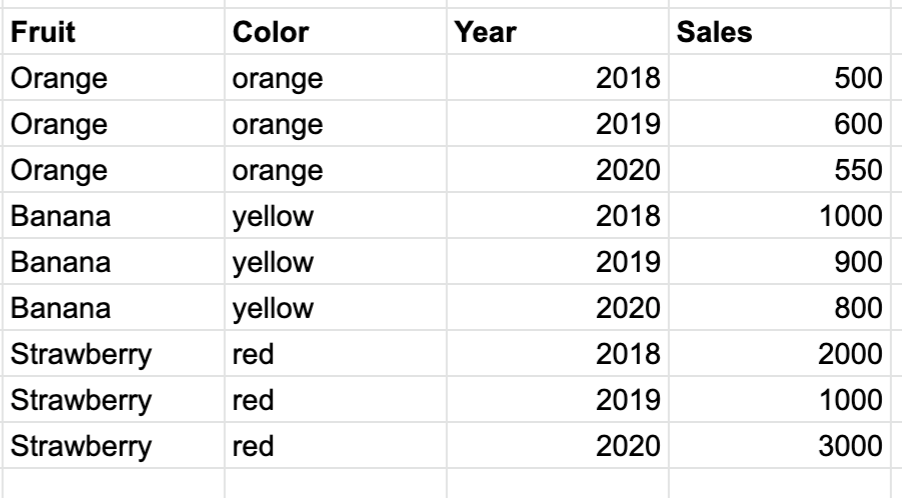
Another common example is survey data, where each survey question is a separate column. We recommend restructuring the data so that there is a Question column and a Response column, and each question response is on a separate row.
Restructuring data can be tricky, but it's a lot easier with the right tool. We recommend Alteryx Designer Cloud. If you need help, please reach out to us by clicking the blue button in the bottom right of your workspace and starting a chat.
9. Remove number formatting
Any column with numeric data should be free of formatting that adds thousands separators, $, %, USD, EUR, etc. You should just have numbers, either with or without decimals. A period . should be used as the decimal separator. Negative numbers should be indicated by a - before the number, e.g., -2567.4.
10. Confirm numeric columns contain only numeric data (or nulls)
Numeric columns should only contain numbers or nulls. Anything else will prevent you from using the column in measures that use sum(), avg(), min(), or max() aggregation functions. You'll want to remove things like spaces, "--", "N/A", "#N/A", "NULL", and "#ERROR". While true nulls (i.e., empty cells) are ok, words like "null" or "blank" are not. A period . should be used as the decimal separator. Negative numbers should be indicated by a - before the number, e.g., -2567.4.
11. Confirm date columns contain only dates with date formatting (or nulls)
Date columns should only contain dates or nulls. Dates should be formatted like MM-DD-YYYY, MM/DD/YYYY, or YYYY-MM-DD. While true nulls (i.e., empty cells) are ok, words like "null" or "blank" are not.
12. Add latitude and longitude
If you want to use the Map slice, you will need to have latitude and longitude columns in your data. The latitude and longitude fields in your data must be numbers, not strings. In other words, your latitudes should look like 38.8977 rather than 38.8977° N . Likewise, your longitudes should look like -77.0365, rather than 77.0365° W.
13. Do a final check
You're almost there! Do a final check to make everything looks ok. Should null values be null? Do values contain carriage returns, leading or trailing spaces, or anything else odd? The TRIM() function is useful for dealing with large numbers of leading and trailing spaces.
14. Download your data as a CSV or Excel file
Download your prepared data as a CSV file, with commas , separating the values. Give it a meaningful but brief name and save it in a location you can easily find.
Congratulations! You're now ready to load data.
Last updated
Was this helpful?